Blog · Investing
The Map to Investing: What it Does and Doesn't Tell Us
L.J. Jones, CPA & CFP® · January 17, 2022
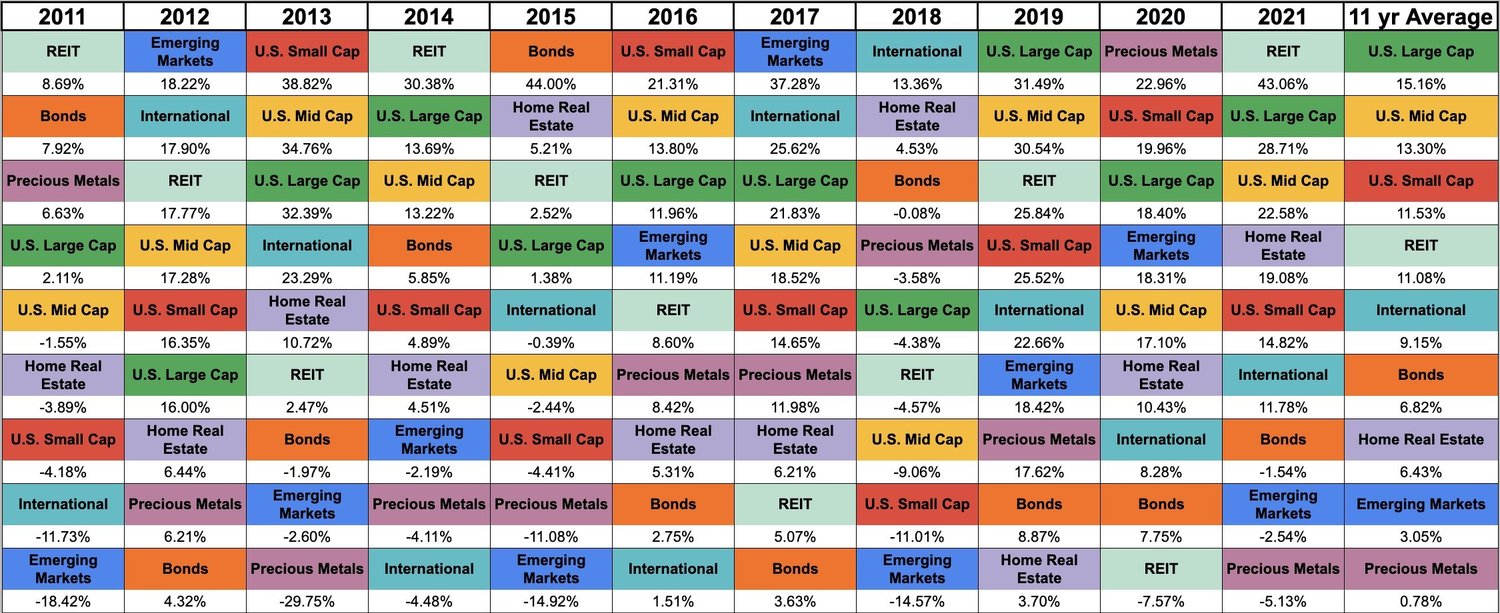
If you were to map how different asset classes have performed over the last 11 years, you would see that it's a random walk toward higher prices. The top performers never stay at the top and the bottom performers never stay at the bottom. Over time, these fluctuations average out. As an investor, this map teaches two lessons: diversify, and past performance is not an indicator of future performance.
How difficult is it to invest? The answer: it depends. Investing can be as complicated or as simple as someone wants to make it, but there are general principles that even the most novice investor can implement.
What is the asset class map?
The asset class map is a year-by-year comparison of various asset classes going back to 2011, tracked through indexes: US Large Cap (S&P 500), US Mid Cap (Russell Midcap), US Small Cap (Russell 2000), International (MSCI EAFE), Emerging Markets (MSCI Emerging Markets), Home Real Estate (S&P/Case-Shiller US National Home Price Index), REITs (MSCI US REIT), Precious Metals (S&P GSCI Precious Metals), and Bonds (Barclays US Aggregate Bond Index). Indexes are tools to track performance — you can't invest directly in one, but index funds attempt to replicate them.
What the map tells us
Past performance does not indicate future performance. Looking at the map, no asset class has ever repeated an identical performance from one year to the next. Zero asset classes that were the top performer in a given year were also the top performer the following year. The same is true at the bottom. A common investing mistake is chasing last year's winners, assuming the outperformance will continue — it usually doesn't, and it often means missing whatever asset actually outperforms next.
Diversification is important. Asset classes rotate through best-performing, worst-performing, and everywhere in between over the years. Owning a mix gives investors a better chance of holding a top performer in any given year, offsetting the years when other holdings underperform. Bonds, for example, have historically had a low correlation to stocks — when stocks drop sharply, bonds often hold up better, cushioning the portfolio and requiring a smaller percentage gain to recover to the starting value.
Short-term performance is volatile. Emerging Markets averaged a 3% annual gain over the studied period, yet lost roughly 18% in one year and gained over 37% in another. Reacting to short-term swings — selling after a bad year, buying after a great one — tends to backfire, since past performance doesn't predict what comes next.
What the map doesn't tell us
It can't tell you how to invest for you. The map shows that diversification helps and volatility is normal, but it says nothing about how much of each asset class fits your specific risk tolerance. A lawyer nearing retirement and a lawyer who started investing a year ago should not have identical portfolios — risk tolerance is personal, and the map doesn't measure it.
It can't predict the future. The dataset only reflects the post-2008 financial crisis period (aside from the brief COVID decline), so it offers no view of true recession conditions. No one accurately predicted a worldwide pandemic disrupting supply chains in 2018 — another unlikely, high-impact event is inevitable, and we simply can't know what or when.
The asset class map is a great tool, but it is not the foundation of an investment plan by itself. It's a visual reminder of the dangers and opportunities investors experience over time, and the key lessons — diversify, and take a long-term view — apply to any investor's life.
Investing effectively is a top concern for many young lawyers, and investing incorrectly can set back your path to financial freedom. Developing Financial includes investment management as part of our ongoing financial planning service.
Have questions of your own?
I’m not taking new ongoing clients right now, but I’m still glad to offer a free 30-minute Meet & Confer — to answer your questions, add you to the waitlist, or point you toward another advisor.